Warning there are some tall-ass images in this post.
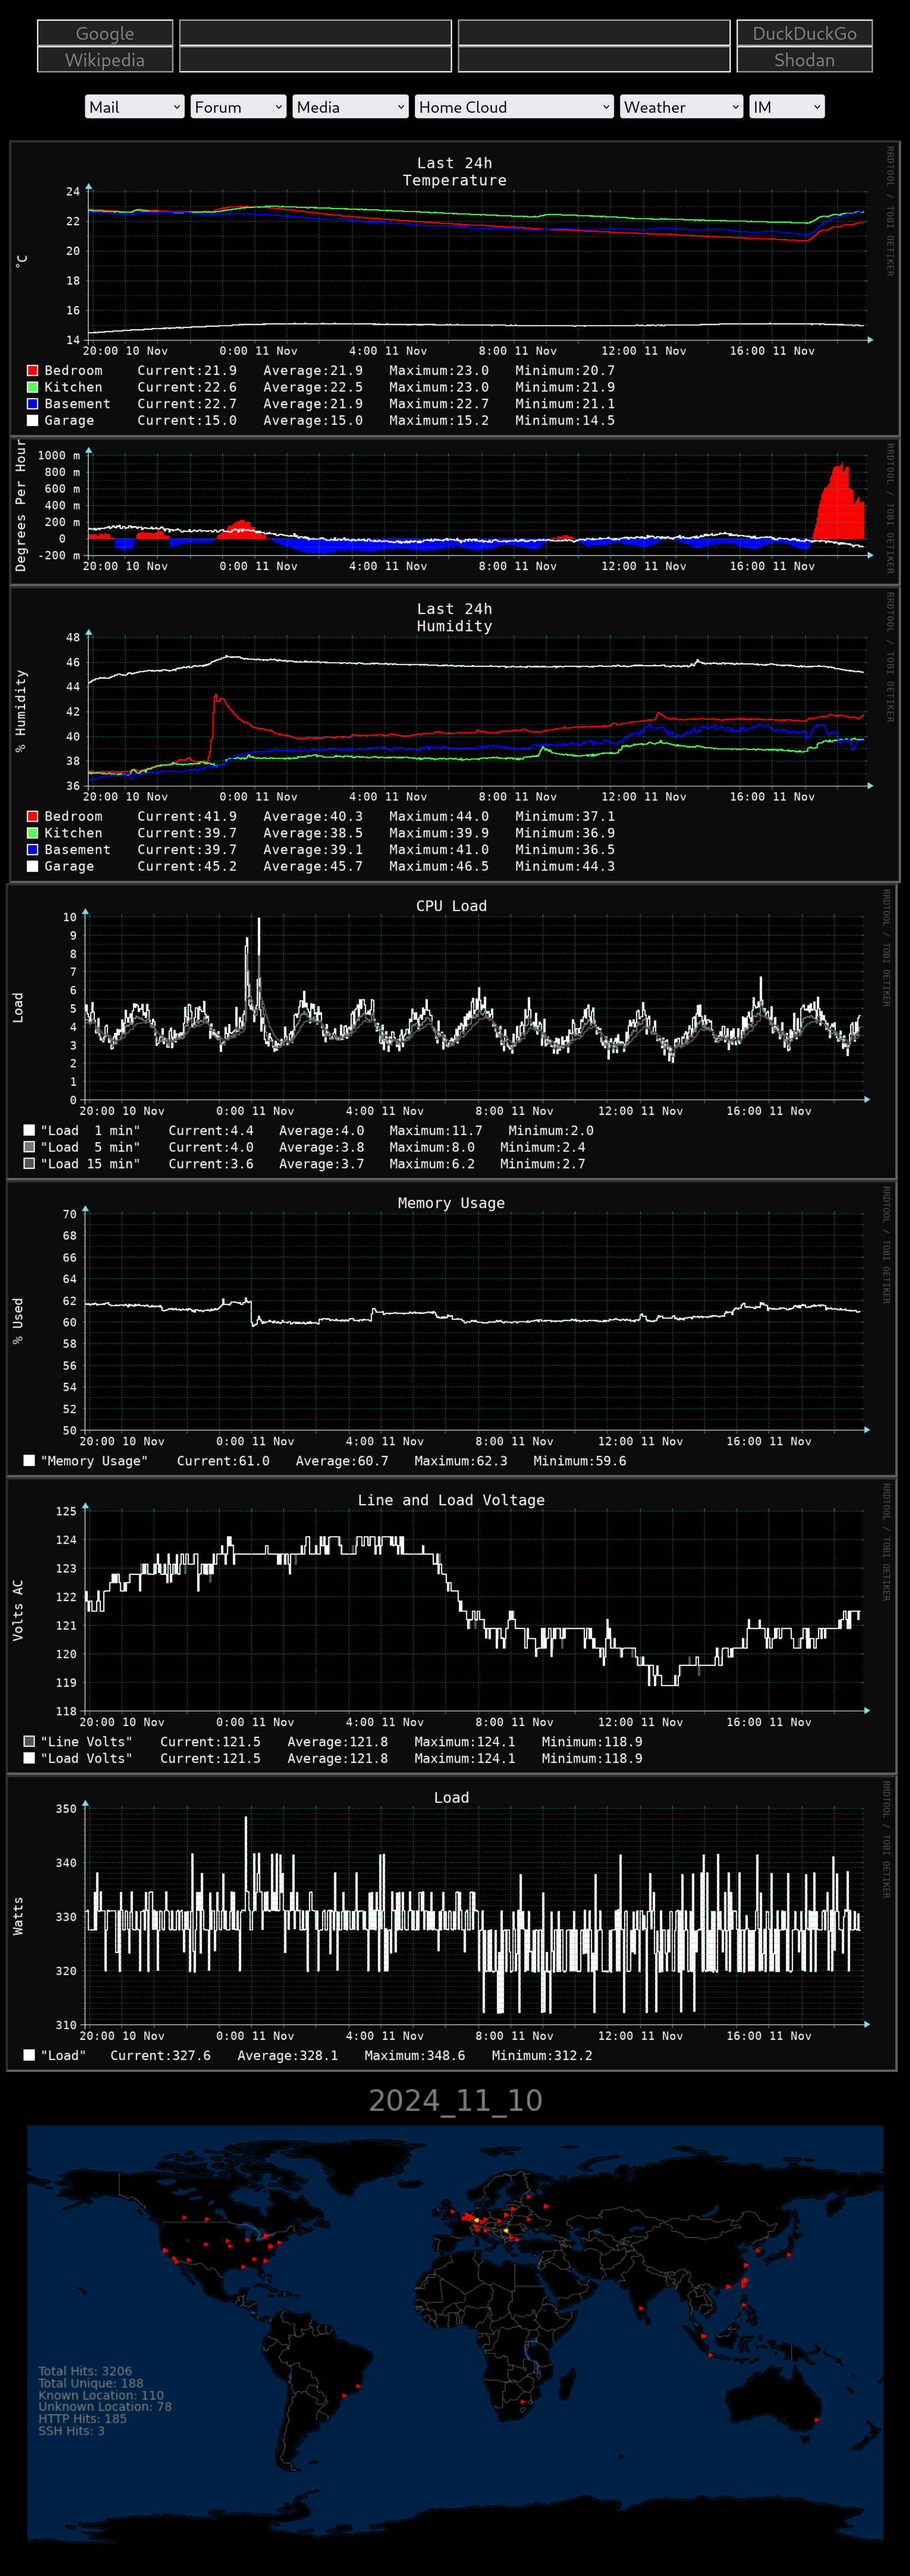
A few years ago I got mad enough at the temperature gradient in my town house that I designed and build a bunch of ESP8266 sensors to feed data into an RRD so that I could have some pretty graphs to be angry about as well. (As of this week I have also started logging stats from my UPS and server.) Using the minimum of HTML and CSS I threw those graphs, a map of the previous day’s incoming network traffic, and some convenient links onto a homepage that I use on all of my devices. At a glance this tells me if the furnace/AC is working, if my server is having a fit for unknown reasons, and if the local power grid is playing it fast and loose with the voltage and frequency (which I suspect they do).
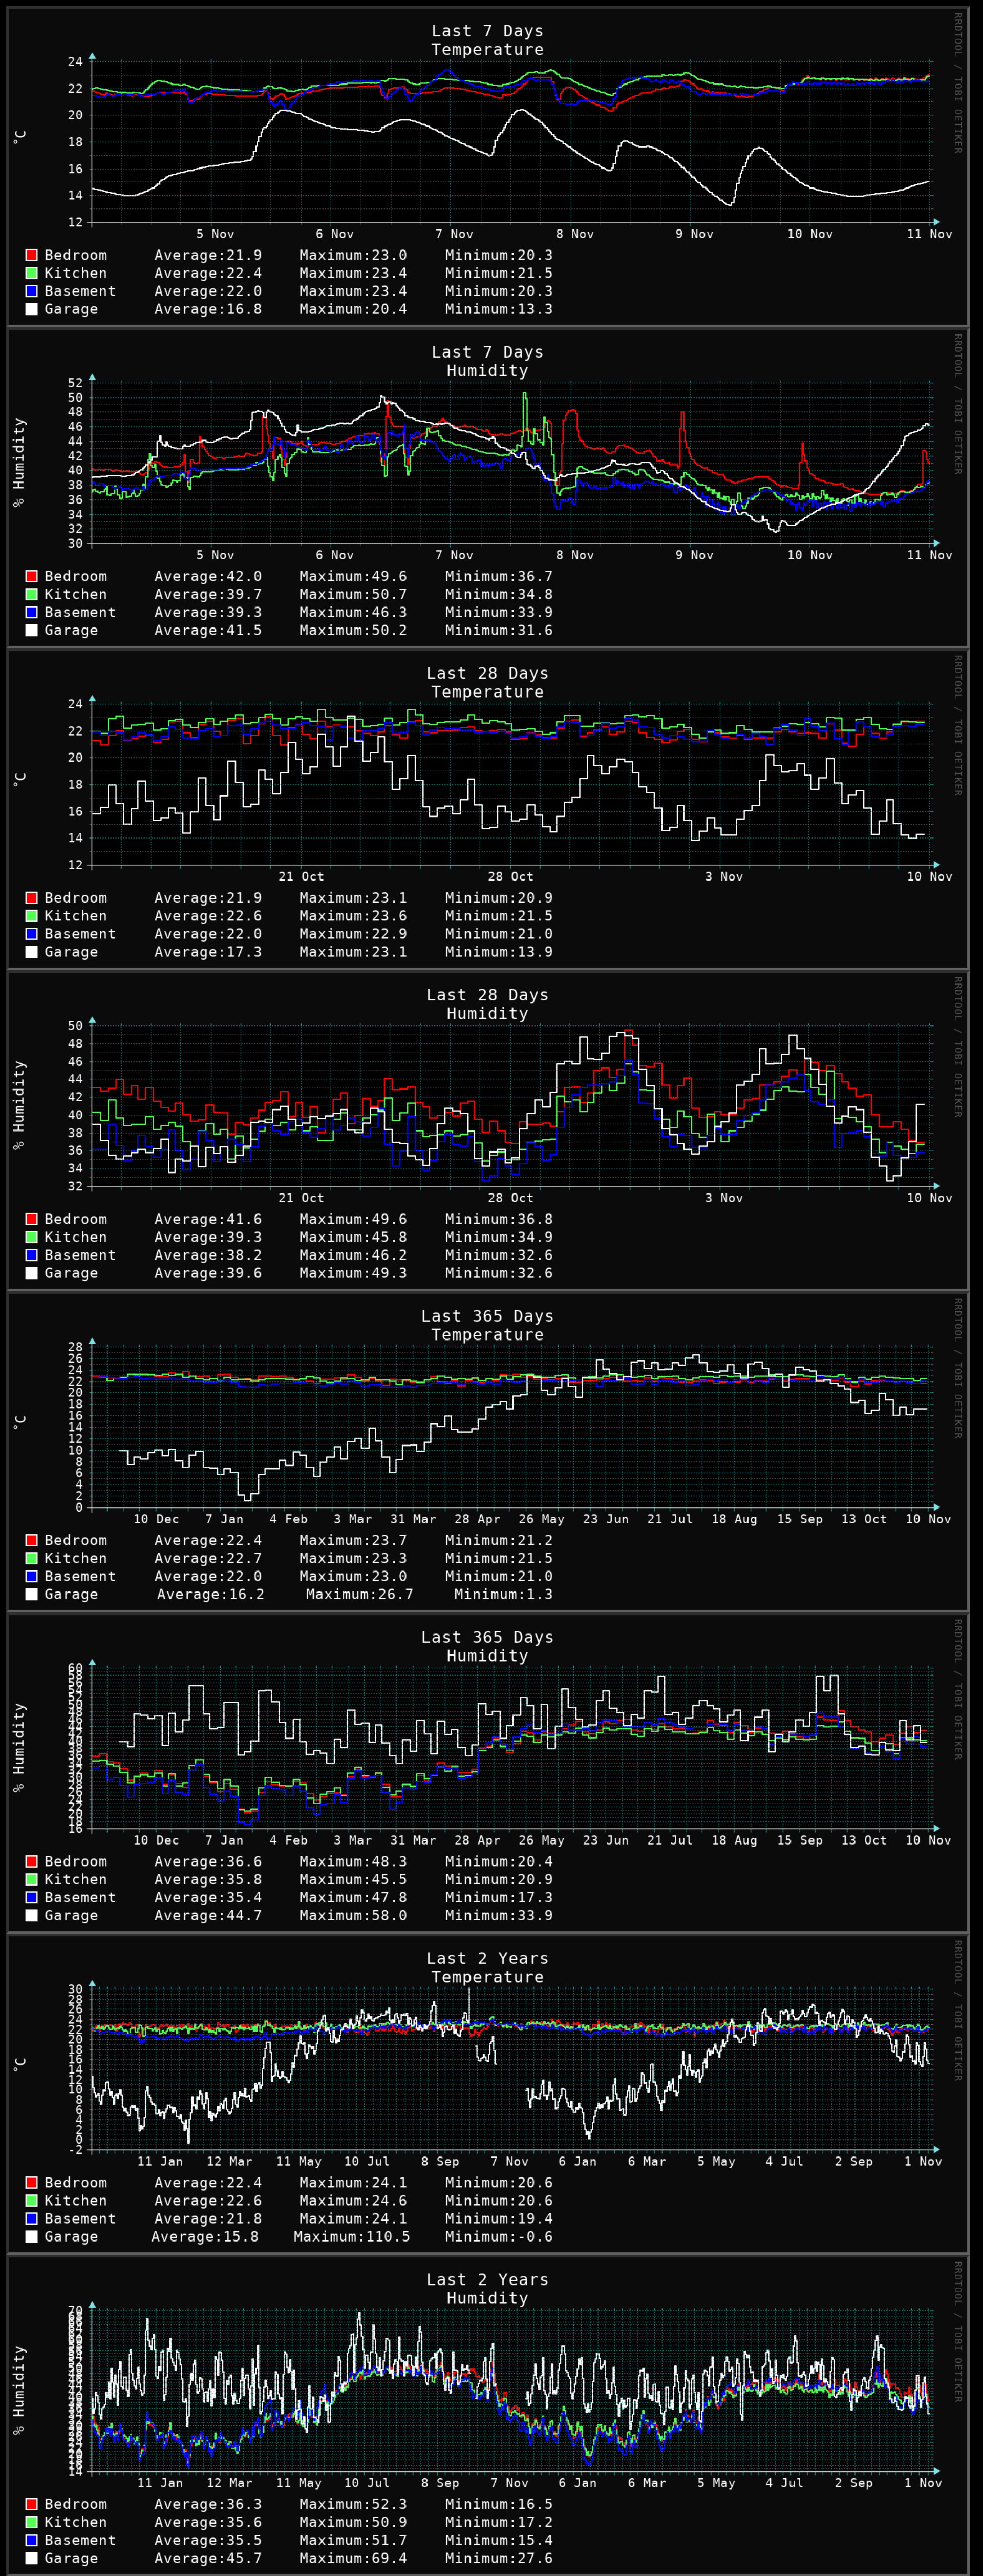
Clicking the temperature/humidity data leads to a long term data page covering 2 years of data in varying resolution. The gap last fall was when the garage sensor failed and I was waiting for Aliexpress.
There are also long term trends for the server load and UPS but they have only been logging for a few days so there is not much to look at.
Clicking the map on the home page leads to a text file containing a summary of all incoming traffic to apache and ssh. The ssh server is on a high port number and doesn’t see much traffic but occasionally a persistent bot will find it.

Everything but my landing page (this animation in p5.js https://old.reddit.com/r/cellular_automata/comments/1djwjbu/waves_processingorg/ with the text “Hey this isn’t where I parked my car” overlayed) is behind basic auth or better and I have push notifications set up for every ssh login (even my own), in 5 years I have never had a successful login from an attacker, this is not an invitation, have mercy.
All the data is gathered with python scripts and stored in RoundRobinDatabases or, in the case of network data, digested down into a CSV. The climate sensors respond to requests on port 80 with the temperature and humidity separated by a comma to allow for easy polling. The map is generated by looking up the IPs’ information on Shodan then plotting the location data if it was present.
Absolutely none of this is the ideal solution, there are existing projects that cover literally every aspect plus a dozen extra features I could never hope to implement. I wrote as much as I could from scratch just to see if I could, it’s more fun to drive a shitty car that you built than one you bought from the dealer.
Aaaand I accidentally made the UPS database only 24hrs instead of the 10years I had intended. Lucky for me rrdtool has a function to expand an rrd without wiping out the data!
What caused the massive spike in humidity in the bedroom shortly before midnight?
My mind went to a dirty place is all I’m saying.
It’s actually surprising how much just having a person in the room can alter the temperature and humidity levels. In my master bathroom, I have my bathroom fan set to activate when the dew point reaches a certain level (I’ve found that dew point produces better results than just humidity); the idea is that the bathroom will be ventilated when someone takes a shower and for however long it takes for the humidity to dissipate after they’re done. The funny thing is that every so often, I’ll take an excessively long poop (lets me honest, I’m scrolling on my phone), and the fan will kick on. Just being in the bathroom will alter the dew point enough that it triggers the fan.
I also have a room that contains all my server/networking equipment. It’s climate-controlled, and I’m constantly monitoring temperatures. The times that in the room working, I can see a noticeable spike in the temperature graph, even though the only variable that’s changed is that there’s a person in the room.
So my point is: OP might not have been having fun that night; it’s entirely possible someone just came in and went to bed.
Yeah OP said they had a late shower that night which get my mind out of the gutter.
We all know you fart in your server room. That’s perfectly normal as that’s one of the main uses.
The shower, we went to bed late. There was also a rainstorm that night which skews things, but it’s curious that the shower will actually raise the humidity of the whole house for hours after it’s been used.
Thanks for the answer.
I find it fascinating to graph things like this and the trends you can notice. Which further highlights how big corporations are able to make insane predications because of the sheer number of data points they have.
I noticed pretty quick how much the weather outside affects the inside of the house. When it’s windy the bedroom temperature drops fast. If it was sunny in the day there will be a peak temperature several hours after sunset as the heat soaks through the west facing brick wall. When the outside humidity jumps the inside follows fast but if the humidity drops outside it takes days for the house to catch up.
If I was clever I could probably set up a predictive thermostat that takes into account the next 6 hrs of weather when choosing to run the heat or air.
this is fucking awesome and really interesting
Really really sick. I love those graphs, and the desire to create visual data to be angry at
Previous to this the basement was always 5 degrees warmer than the rest of the house because the ductwork was so terribly installed. I spent a week sealing them all up only to find that what feels comfortable has as much to do with the humidity as the temperature so just balancing flow between floors couldn’t fix everything.
I like it :) Can you provide a link to the sensors you used?
I used AHT21 I2C modules from Aliexpress https://www.aliexpress.com/item/1005002613543870.html . I think the one that failed last fall was a bad solder joint but I had a spare AHT21 board and ESP8266 so I just replace the whole unit.
Nifty! I built something similar for my university graduation project. Did a PCB, ESP8266 based as well. Temperature, humidity, sound, vibration, airborne particulate sensor, and some other stuff.
Wrapped a server up in docker for receiving the data, basic dashboard in JS for minor reactivity in components. Never ended up actually doing it cause I didn’t have a consistent host, but maybe I should spin it up again now that I have a home server.
Cool project, looks neat! Anything you were caught off guard by when doing this?
The weather outside changes things indoors way more than I expected. By looking at the graphs I can tell if it was a windy day, if it rained at all, if it was sunny and which blinds were open that day.
Insulation well good insulation is wildly expensive but saves most of all its the largest expense usually.
This is a 10 year old house and was supposed to be built with all the latest energy saving tech, except it’s Canada and I doubt it would have passed inspection even on the day it was sold.
Sounds like a US home lol Welcome to modern quality control where things went downhill instead of up like modern society thinks. You can actually quantify this. Look at sales of vintage and old goods. Their prices are very high and have a high demand. Modern plastic and construction has gotten of poorer quality.
I ran my first “smart” phone for more than 5 years before needing an upgrade. My latest Pixel 8 is less than a year old and now has a row of pink pixels. Never been dropped, never been wet, never fast charged.
Home Assistant with a bunch of ZigBee sensors?
Nope, home made sensors and python scripts.
Amazing stuff!
What made you go with a custom solution instead of something like home assistant?
Why wouldn’t you reinvent the wheel? That’s the fun part
Definitely nothing wrong with that!!
That is pretty much why. I took one programming class in high school (2004) and since then alway enjoyed solving software puzzles.
What do you use for furnace/AC monitoring? Do you get data directly from the equipment, or just infer it from environmental trends? I assume the power data comes from embedded monitoring facilities in your UPS? What make/model do you have? I have a similar setup in my house, but it’s lacking a few metrics. Monitoring air quality (CO2, particulates, etc) would be nice, and my local electric provider sounds a lot like yours, so voltage monitoring would be great.
I just infer from the temp/humi sensors. When either one runs there is a very clear pulse in both readings. The UPS is an APC1400XL, it tells me it was manufactured in 2003, I cleaned out the exploded batteries and put new ones in this year and it worked fine. I think it was only ever used once (until the original batteries burst). I have the UPS supplying my server, NAS and the POE switch that powers a couple of cameras outside.
