

This study from MIT used geo data collected from cars in Milan, Italy, to check the effectiveness of 30 km/h zones in reducing speed.
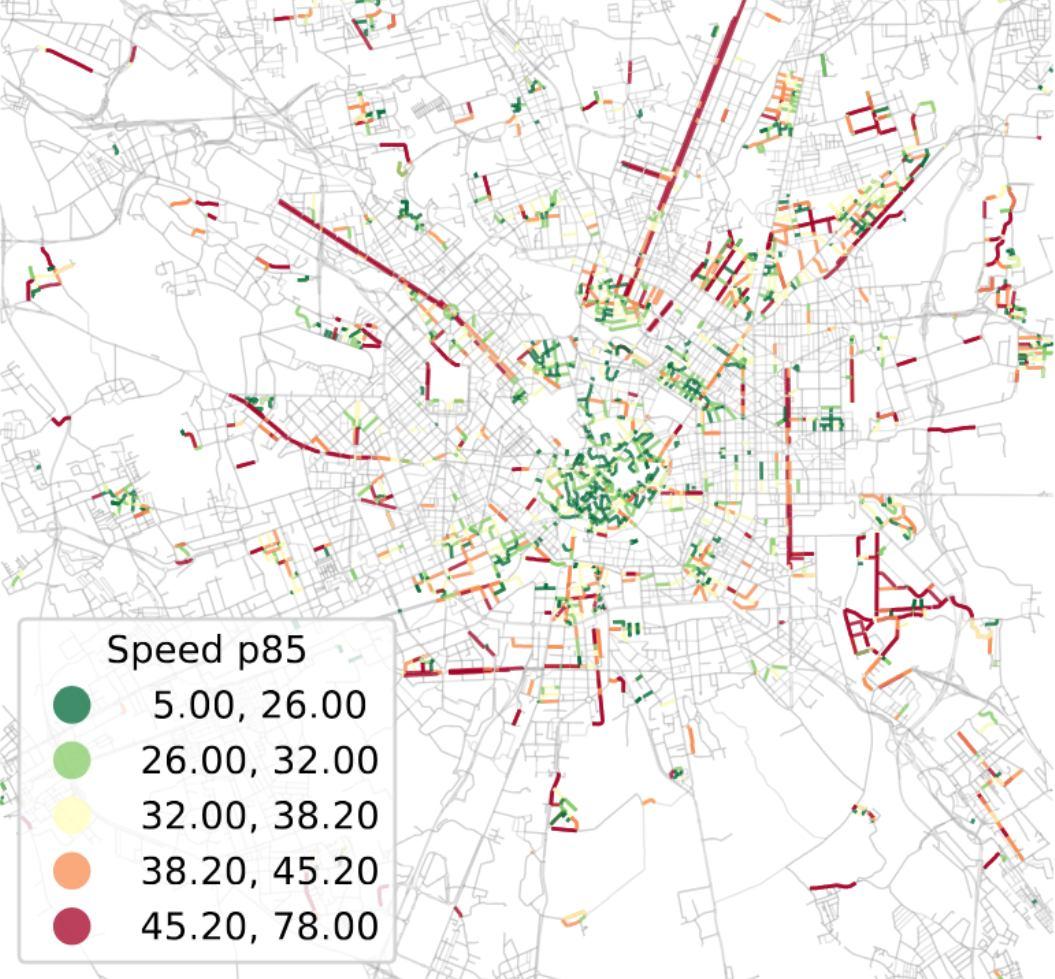
The first conclusion is that the signs don’t work: 85 percentile speeds are all over the place in 30 km/h zones in Milan, as shown in the figure below:
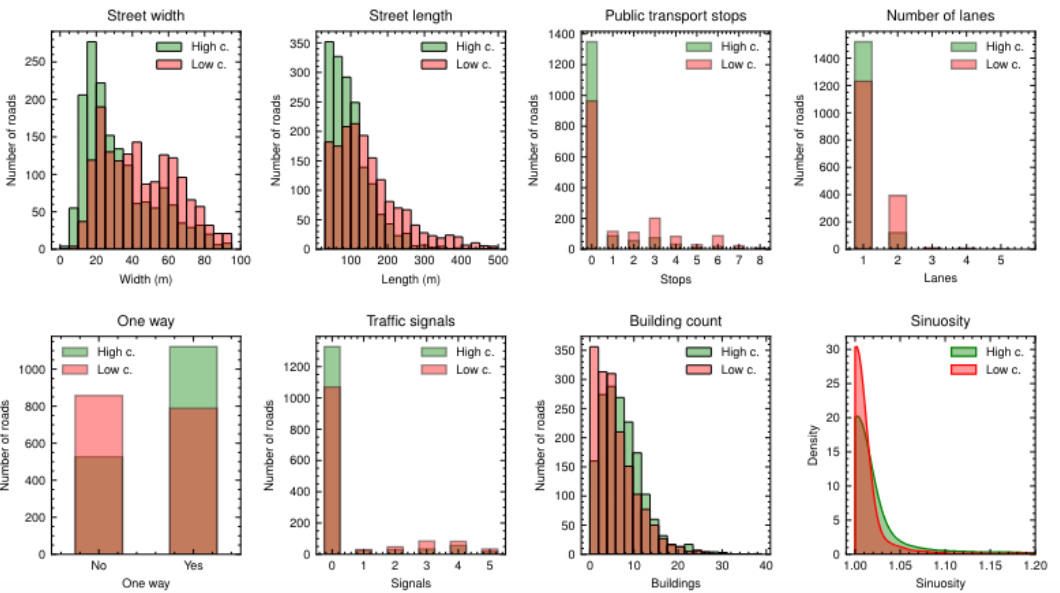
The second step was finding correlations between speeds and street features extracted from openstreetmap. Results are as expected: narrow, short, curvy sections correlate with lower speeds, as do 1 lane vs more, one way vs 2 ways:
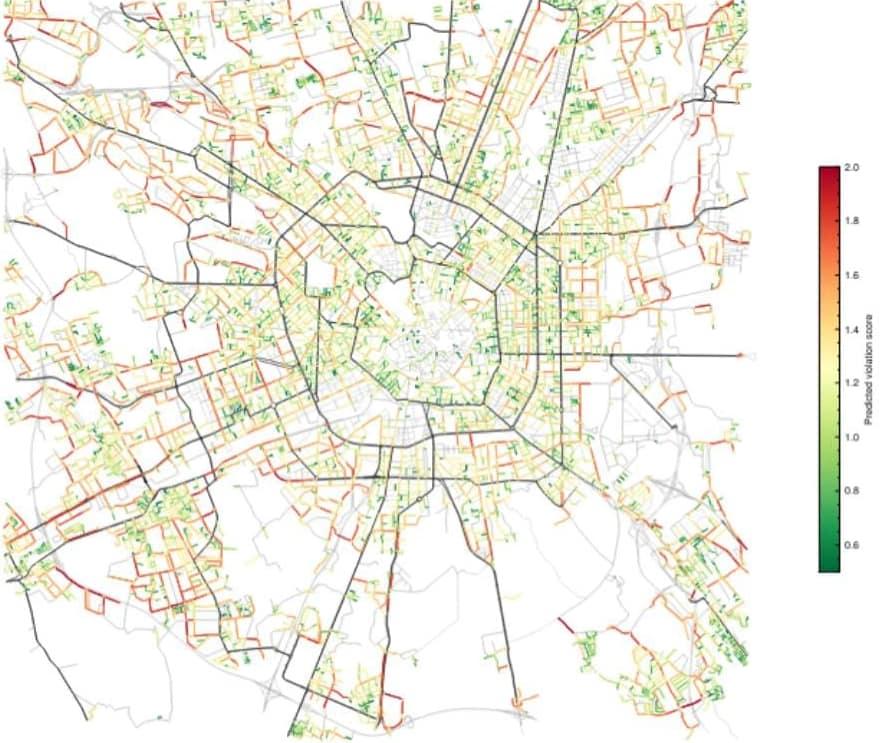
The final step is also interesting: the authors made a model to predict the compliance of 30 km/h speed limit on streets that are 50 km/h at the moment. Useful for urban planning to understand if charging an area to 30 km/h would need structural interventions (like bumps, narrowing of the street…) or not:
There is so much more in the article, I suggest to read it fully.
crossposted from: https://mastodon.uno/users/rivoluzioneurbanamobilita/statuses/114827312307353297
People drive at whatever feels safe. If I’m driving down a 5-7 lane stroad with wide lanes, I’m doing 60mph+, I don’t give a shit what the limit is. Narrow the lanes, put in bike lanes with barriers, street parking (if any) outside the bike lanes next to the driving lanes, add crosswalks with flashing yellow lights, I’ll cut my speed in half or more because that’s what feels safe.
Behavioral engineering is more effective than seemingly arbitrary signs.